In this project, I used Excel, SQL, and Power BI to create a “Spotify Wrapped” style dashboard which showcases my Spotify Listening History from 2019-2024.
Excel
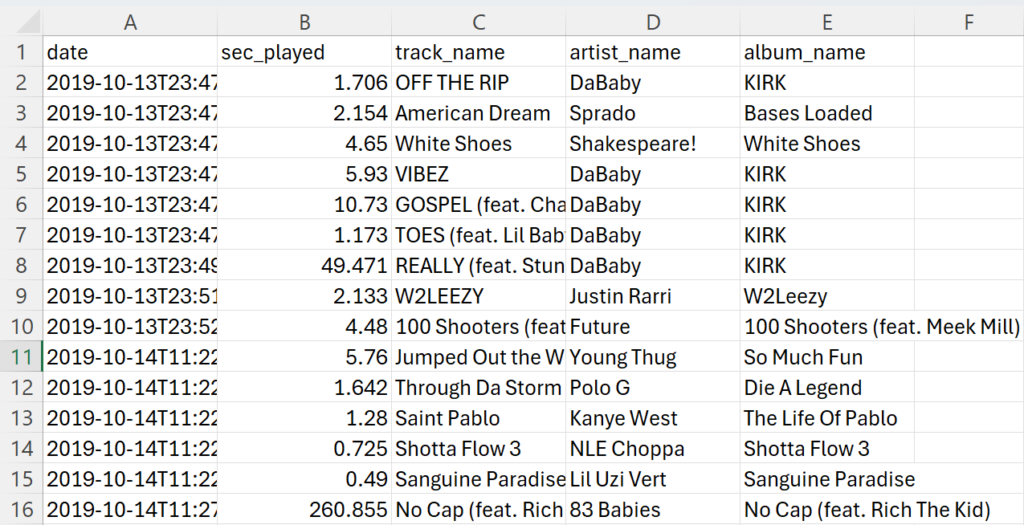
The original dataset was in JSON format. I used Excel to convert it to a structured tabular format. I then removed columns that were not necessary for analysis. Here is a screenshot of the table that I imported into SQL Server:

SQL Server and SQL
I cleaned the data by:
- Deleting rows where track_name, artist_name, or album_name were NULL
- Deleting what I call “Non-Songs” (i.e., White Noise audio tapes)
- Deleting rows where sec_played was less than 30 seconds. This was the cutoff I chose. I felt that 30 seconds was a solid marker to count a song as “listened to”
Next, I created the following tables and inserted data from the original table into them:
|
1 2 3 4 5 6 7 |
create table tracks ( full_track_id int identity (1,1) primary key, track_name varchar(225), artist_name varchar(225), album_name varchar(225) unique(track_name, artist_name, album_name) ) |
|
1 2 3 4 5 6 7 |
create table listening_history ( row_id int identity (1,1) primary key, full_track_id int, date datetime2, hours_played decimal (12,8), foreign key (full_track_id) references tracks(full_track_id) ) |
Some notes:
Each row in the tracks table is unique. Because two or more songs can have the same name, I wanted to make sure that I was accurately counting the number of unique songs listened to.
The dataset did not have any identifiers for artist_name, and I couldn’t figure out how to create one like I did with full_track_id. In this case, I think the consequences of not being able to distinguish between different artists with the same name are pretty minimal. Regardless, this means that the number of “Unique Artists” listened, and “Top 10 Artists by # of Times Played” calculations and visuals are ballpark estimates and are probably not exact.
Next, I joined listening_history to tracks and did some transformations on the date column. I created a VIEW with the following query, which I called vw_listening_summary
|
1 2 3 4 5 6 7 8 9 10 11 12 13 14 15 |
select l.row_id, l.full_track_id, l.date as full_date, --FORMAT function on the date column for use in Power BI slicers format(date, 'yyyy') as year, format(date, 'MMMM') as month, format(date, 'dddd') as weekday, l.hours_played, t.track_name, t.artist_name, t.album_name from listening_history l left join tracks t on l.full_track_id = t.full_track_id |
Power BI
I imported tracks and vw_listening_summary into Power BI and began creating my dashboard, where I wanted to display my top tracks, artists, # of unique songs and artists listened to, etc. Most of all, I wanted to be able to filter by year, month, and weekday. Because it’s very satisfying for me to see my top songs and artists during let’s say: each of the Saturday’s in May, 2022.
I only did a few transformations in Power BI. I added a column for the “Top 10 Tracks by # of Times Played” visual, so that I could see the track name as well as the artist:

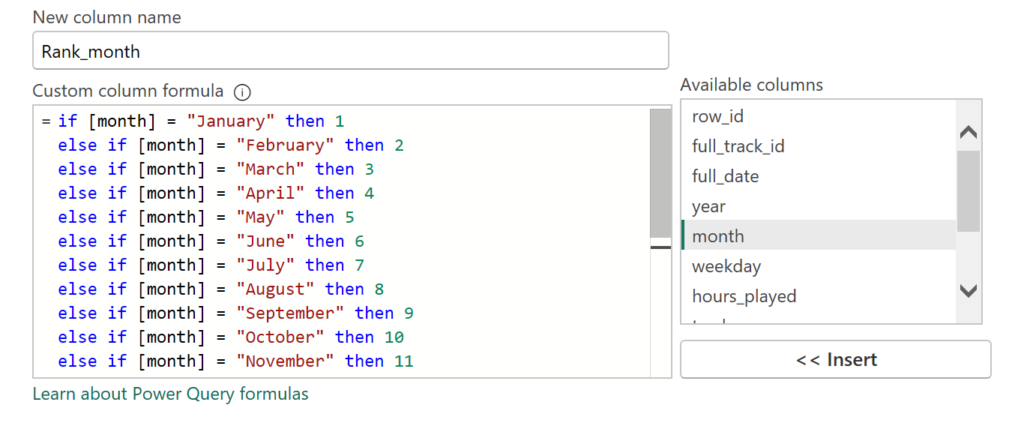
I added columns ranking each month and weekday in numerical order, so that I could order the “Month” and “Weekday” slicers properly:

And that’s pretty much it. I might make another post sharing some queries that answer interesting questions. For example, here is a query that outputs what I call my “Forever Songs”, or songs that I listened to at least 3x per year from 2019-2024:
|
1 2 3 4 5 6 7 8 9 10 11 12 13 14 15 16 17 18 19 20 21 22 23 |
with cte as ( select format(date, 'yyyy') as year, full_track_id, count(*) as times_played from listening_history group by format(date, 'yyyy'), full_track_id having count(*) >= 3 --Songs played at least 3x ) select c.full_track_id, t.track_name, t.artist_name from cte c left join tracks t on c.full_track_id = t.full_track_id group by c.full_track_id, t.track_name, t.artist_name having count(*) = 6 --Appeared in 2019, 2020, 2021, 2022, 2023, 2024 (6 periods) |
Output:

Thank you for reading.